
The French railway system comprises 29,273km of track, and surveying them so that they are safe and well maintained is a constant challenge for national rail operator SNCF. However, the task may become easier in the future thanks to the StreetMapper technology. Owned and operated by Nantes-based FIT ESIC and developed by UK-based 3D Laser Mapping, the rail-mounted system has created a 3D topographical map of tracks on the country’s network and their surroundings using light detection and ranging (LiDAR), a leading technology for 3D surveying and mapping.
Go deeper with GlobalData

The StreetMapper enables high-precision mapping to a range of 800m, with a capacity of 550,000 measurements per second per sensor, and records accuracies of better than 10mm. Frances Marcellin spoke to Marc Daeffler, director of FIT ESIC’s engineering division, to find out more about StreetMapper’s SNCF commission and the challenges faced along the way.
Frances Marcellin: StreetMapper has been used so far to survey several hundreds of kilometres of track for the SNCF. How was the project structured and is it still ongoing?
Marc Daeffler: It’s not a project as such, but several small projects initiated according to the maintenance and design needs of SNCF. The projects started in early 2013. No "end" of the project is planned today, and no entire mapping of the rail network is planned either.
FM: Can you give an overview of how the 3D LiDAR technology works?
MD: The StreetMapper technology is based on the integration of three main components. Firstly the high accuracy survey-grade inertial navigation system, which records 512 positions and orientations per second, with a centimetre-level accuracy. The other components are two LiDAR scanner heads measuring 550000 points per second each and a twelve-megapixel panoramic camera, capturing five frames per second, which makes one image every four to five meters at normal train speed.
See Also:
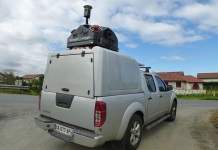
The system is mounted on a flatbed carriage towed by a locomotive. The StreetMapper data is recorded during the survey, and processed afterwards in two main steps: pre-processing and post-processing. Pre-processing consists of processing the trajectory of the StreetMapper, the LiDAR point clouds and the positions and orientations of the panoramic images, and post-processing consists of analysing this data and extracting the useful geometric and semantic information.
How well do you really know your competitors?
Access the most comprehensive Company Profiles on the market, powered by GlobalData. Save hours of research. Gain competitive edge.

Thank you!
Your download email will arrive shortly
Not ready to buy yet? Download a free sample
We are confident about the unique quality of our Company Profiles. However, we want you to make the most beneficial decision for your business, so we offer a free sample that you can download by submitting the below form
By GlobalDataFM: How much ground does the StreepMapper cover?
Between heavy rainfall, storm surges and coastal inundation, flooding poses a persistent problem for Britain’s vulnerable rail system.
MD: The distance covered per day approximately ranges from 40km to 150km of tracks captured in both directions, depending on the traffic restrictions and permitted slots.
FM: How does the technology improve the security of survey personnel?
MD: The technology allows the mobilisation of a very limited field survey team on the tracks. Those remaining are for surveying control points and performing complementary surveys of hidden objects such as, for example, hydraulic and engineering structures located under the track.
Overall, the time spent on the track by the survey teams represents a small percentage of the time that would have been necessary for doing the same job with traditional surveying techniques.
FM: What is the data used for?
MD: The data is used for maintenance: designs for resurfacing of rails (ballast, super elevations and gradients); refit designs of catenary cables; rail infrastructure inventories (signaling, contact ramps and speed control beacons).
Another use is clearance analysis of the rail infrastructure: signaling, footbridges, station platforms, engineering structures and for vegetation control, such as planning of pruning campaigns.
At the end of the survey and pre-processing tasks, engineers and CAD specialists have an accurate and complete 3D virtual model of the entire rail track and its surroundings, displayed on their screen. Based on this 3D virtual point cloud model, distances or clearances can be measured, and any object of the track can be modeled in vector formats, at any time after the survey.
FM: How does StreetMapper reduce the time usually required for such a project?
MD: Thanks to the high productivity of the StreetMapper, the raw data is collected within a couple of days. After that, mapping and geometric analysis tasks can be distributed much easier than a traditional survey would allow it. This results in significantly reduced time-to-delivery. Moreover, part deliveries can also be made, which makes the first products available faster.
FM: Can you give details on how the project/mapping tool will build a detailed topographic map of the entire track system, and provide essential data as well as spot dangerous objects?
MD: In parallel with the projects performed by FIT ESIC, the SNCF themselves operate a Riegl VMX-450 mobile mapping system, which they use for mapping long distances of tracks, for clearance analysis purposes – mostly for securing and increasing freight traffic capacities. About 10,000km were captured for that purpose so far.
As far as we know, there is no established plan for capturing the entire network. Operational needs are driving the progress.
FM: Can you tell us about the challenges encountered during the mapping project so far?
MD: Measuring control points on the tracks is a significant security issue, making it necessary to be assisted by SNCF announcers (people who warn the surveyor of a coming train) – at least two for one surveyor, which is an issue in terms of logistics, availability and costs.
The StreetMapper has to be powered by a specifically integrated rugged external power supply, because the locomotive cannot provide the power for the survey system. It also needs to be remotely operated – which requires a specific cabling system – because it is installed within the confines of a flatbed carriage towed by the locomotive housing the surveyors and the control unit in a very narrow space.
The vibrations on a train are very specific and different from those can be observed on a car. Therefore, a specific high frequency IMU (512 Hz) adapted to the vibration signature (amplitude and frequency) has been integrated in FIT ESIC’s StreetMapper. In addition, a specific shock absorbing system was developed, that integrates silent blocks derived from the aerospace industry, following 3D Laser Mapping’s IMU-based vibration analysis performed on our StreetMapper.
Future of Rail 2050, a new report by engineering firm Arup, throws up some innovative and occasionally off-the-wall solutions to the challenges that the rail industry is likely to face.
The last issue that is specific to rail surveys is the measurement of the trajectory. Specific algorithms and methodologies were developed by 3D Laser Mapping, IGI Systems and FIT ESIC, to deal with the specificities of rail track surveys: smooth turns, smooth accelerations and decelerations.
FM: How were the length and cross profiles of the track generated?
MD: The profiles are derived from cross sections made from the LiDAR point cloud. Human expertise is then necessary for drawing the profiles, including rail data.
They are mostly used for generating an accurate and reliable description of the track before maintenance operations, in order to make an appropriate design that meets the civil engineering and traffic security standards.
FM: In terms of clearance analysis, how are potentially dangerous objects detected, identified and measured to determine clearance from the track and trains?
MD: Potentially dangerous objects include the vegetation, station platforms, engineering structures, foot bridges, signs and catenary poles. A specific algorithm is running a theoretical cross profile (which changes dynamically according to the curve radius, super elevation and speed) of a train along the track and detects clashes with the LiDAR point cloud.
The inventory of clash objects and their location in the rail track reference system is exported at the end of the process.